
The code for the library used in this post can be found here. It is only intended as a proof of concept, so user beware!
Final Product
Here is a simple .NET profiler implemented in Rust that prints the name of a function just before it is JIT compiled. The client library must create a type that implements all of the CorProfilerCallback traits. All of the methods in the callback traits have default implementations, so you only need to implement the methods that you actually want to use. COM boilerplate is set up for you behind the scenes with the register! macro call at the end of the code snippet.
#[derive(Clone)]
struct Profiler {
    clsid: Uuid,
    profiler_info: Option<ProfilerInfo>,
}

impl ClrProfiler for Profiler {
    fn new() -> Profiler {
        Profiler {
            clsid: Uuid::parse_str("DF63A541-5A33-4611-8829-F4E495985EE3").unwrap(),
            profiler_info: None,
        }
    }
    fn clsid(&self) -> &Uuid {
        &self.clsid
    }
    fn profiler_info(&self) -> &ProfilerInfo {
        self.profiler_info.as_ref().unwrap()
    }
}

impl CorProfilerCallback for Profiler {
    fn initialize(&mut self, profiler_info: ProfilerInfo) -> Result<(), HRESULT> {
        // Initialize ICorProfilerInfo reference
        self.profiler_info = Some(profiler_info);

        // Set the event mask
        self.profiler_info()
            .set_event_mask(COR_PRF_MONITOR::COR_PRF_ALL)?;

        Ok(())
    }
    fn jit_compilation_started(
        &mut self,
        function_id: FunctionID,
        _is_safe_to_block: bool,
    ) -> Result<(), HRESULT> {
        let function_info = self.profiler_info().get_function_info(function_id)?;
        let metadata = self
            .profiler_info()
            .get_module_metadata(function_info.module_id, CorOpenFlags::ofRead)?;
        let method_props = metadata.import.get_method_props(function_info.token)?;
        println!("{}", method_props.name);
        Ok(())
    }
}
impl CorProfilerCallback2 for Profiler {}
impl CorProfilerCallback3 for Profiler {}
impl CorProfilerCallback4 for Profiler {}
impl CorProfilerCallback5 for Profiler {}
impl CorProfilerCallback6 for Profiler {}
impl CorProfilerCallback7 for Profiler {}
impl CorProfilerCallback8 for Profiler {}
impl CorProfilerCallback9 for Profiler {}

register!(Profiler);
To generate a shared object file capable of being consumed by the .NET runtime, your cargo config file should look like the following:
[package]
name = "demo_profiler"
version = "0.1.0"
authors = ["Han Solo <han_solo@gmail.com>"]
edition = "2018"
license = "MIT"
repository = "https://github.com/camdenreslink/clr-profiler"

[dependencies]
clr_profiler = "0.1.0"
uuid = "0.8"

[lib]
crate-type = ["cdylib"] # This is the key configuration value
On Linux, you will also have to set the following environment variables:
CORECLR_ENABLE_PROFILING=1CORECLR_PROFILER=DF63A541-5A33-4611-8829-F4E495985EE3- This should be the CLSID set in your profiler data type.
CORECLR_PROFILER_PATH=/some/path/demo_profiler.so
Here is some sample output:
...
Contains
Contains
GetLocaleName
IndexOf
IndexOf
IndexOf
get_LCID
LocaleNameToLCID
GetLocaleDataNumericPart
SearchCultureName
.cctor
CompareOrdinal
get_TwoLetterISOCountryName
GetLocaleInfo
GetLocaleInfo
WriteLine
WriteLine
op_Implicit
WriteSpan
MemoryCopy
...
Profiling API Background
The .NET Profiling API is a mechanism exposed by the .NET runtime which allows an external library to hook into certain events such as garbage collection, jit compilation, and assembly loading. One step of the CLR startup routine is checking if a profiler has been registered (using the registry on Windows, and environment variables on non-Windows platforms). If one has been registered, the CLR loads the profiler library into the same OS process as the CLR itself. This allows the CLR and the profiler to communicate by efficiently passing pointers to data back and forth (no IPC overhead required).
Creating COM Classes in Rust
.NET Profiling API interfaces are defined as COM interfaces. The following steps happen when the CLR process starts to hook the CLR and Profiling library together.
- The CLR will call the
DllGetClassObjectfunction exposed by your library. - This will pass back to the CLR an object that implements the
IClassFactoryinterface. - The CLR then calls the
CreateInstancemethod on theIClassFactorythat it now has a handle to. This returns an object that adheres to one of theICorProfilerCallbackinterfaces. - Now that the CLR has a handle to your profiler object, it can call the methods defined on it to provide important information about the behavior of the profiled application (e.g.
AssemblyLoadStarted()orObjectAllocated()).
What does it mean for an object to implement a COM interface?
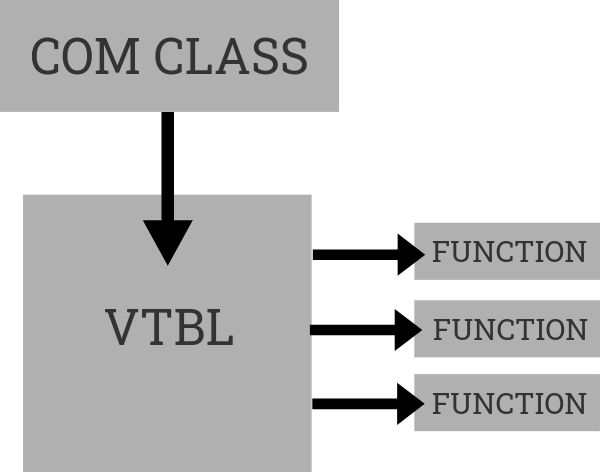
The implementation of COM is very C++-centric. COM objects are expected to be laid out in memory the same way the C++ classes are laid out. A C++ class is a struct whose first member is a pointer to an array that consists of function pointers to that class' method implementations. This function pointer array is called a virtual method table, and we can replicate its structure in Rust.
Here is a simple example:
#[repr(C)]
pub struct IUnknown<T> {
    pub QueryInterface: unsafe extern "system" fn(
        this: &mut T,
        riid: REFIID,
        ppvObject: *mut *mut c_void,
    ) -> HRESULT,
    pub AddRef: unsafe extern "system" fn(this: &mut T) -> ULONG,
    pub Release: unsafe extern "system" fn(this: &mut T) -> ULONG,
}

#[repr(C)]
pub struct IMethodMalloc<T> {
    pub Alloc: unsafe extern "system" fn(this: &T, cb: ULONG) -> HRESULT,
}

#[repr(C)]
pub struct MethodMallocVtbl {
    pub IUnknown: IUnknown<MethodMalloc>,
    pub IMethodMalloc: IMethodMalloc<MethodMalloc>,
}

#[repr(C)]
pub struct MethodMalloc {
    pub lpVtbl: *const MethodMallocVtbl,
}
In the above example, our COM class is implemented by the Rust struct MethodMalloc. It contains only a raw pointer to another struct implementing its virtual method table, MethodMallocVtbl. This method table contains the function pointers corresponding to the IUnknown and IMethodMalloc COM interfaces. Notice that the IUnknown interface is defined as the first field of the virtual method table struct. All COM classes must implement IUnknown. The order of the function pointers in the virtual method table is important, so care must be taken to ensure the functions are laid out correctly.
Implementing DllGetClassObject
In-process COM servers must implement the DllGetClassObject function to provide a way for a client (in our case the CLR) to access instances of the COM classes it provides. In the case of a profiler, we are providing a class to the CLR that implements the ICorProfilerCallback interfaces. If we want to maintain Rust’s type safety, but still provide a generic way to generate a DllGetClassObject function that will return some provided profiler data type, we’ll need to use Rust’s procedural macros feature. This allows a library author to manipulate tokens of Rust source code at compile time to dynamically generate code. Here is an example procedural macro that generates a DllGetClassObject function definition at compile time:
#[proc_macro]
pub fn register(item: TokenStream) -> TokenStream {
    let profiler_type = parse_macro_input!(item as Type);
    let output = quote! {
        use clr_profiler::ffi::{ClassFactory as FFIClassFactory, CorProfilerCallback as FFICorProfilerCallback, E_FAIL as FFI_E_FAIL, GUID as FFI_GUID, HRESULT as FFI_HRESULT, LPVOID as FFI_LPVOID, REFCLSID as FFI_REFCLSID, REFIID as FFI_REFIID};
        #[no_mangle]
        unsafe extern "system" fn DllGetClassObject(
            rclsid: FFI_REFCLSID,
            riid: FFI_REFIID,
            ppv: *mut FFI_LPVOID,
        ) -> FFI_HRESULT {
            let profiler = <#profiler_type>::new();
            let clsid = FFI_GUID::from(*profiler.clsid());
            if ppv.is_null() || *rclsid != clsid {
                println!("CLSID didn't match. CLSID: {:?}", clsid);
                FFI_E_FAIL
            } else {
                let class_factory: &mut FFIClassFactory<#profiler_type> = FFIClassFactory::new(profiler);
                class_factory.QueryInterface(riid, ppv)
            }
        }
    };
    output.into()
}
The line let profiler = <#profiler_type>::new(); will dynamically create an instance of the provided profiler type. This means that the type must provide an empty constructor function, or the macro will fail to compile. Some of the names are prefixed with FFI to prevent naming collisions within any modules that the macro is invoked.
Creating an Idiomatic Rust Facade
Rust has certain patterns and language features that improve safety and make coding more enjoyable. Some effort was made to adapt the Profiling API method signatures to follow Rust idioms.
Using Result<Ok, Err> to indicate potential failure
Almost all methods in the .NET Unmanaged API return an HRESULT, which is a type of error code. In order to achieve returning the intended values from the method along with the error code, mutable pointers are passed into the method and populated. This can be the source of errors, because sometimes it is unclear who is responsible for allocation/deallocating memory for these data structures. The concept of ownership (Rust’s killer feature) addresses this, but we must still deal with it at the FFI (foreign function interface) boundary. For example, the following function returns a ClassID when provided with an ObjectID. A function would typically just have ClassID as the return type, but instead the HRESULT error code is the return type.
HRESULT GetClassFromObject(
    [in]  ObjectID objectId,
    [out] ClassID *pClassId);
This approach is made more Rust-friendly by using the Result type:
fn get_class_from_object(&self, object_id: ObjectID) -> Result<ClassID, HRESULT>;
Calling code can use a match expression to extract the ClassID:
let class_id = profiler_info.get_class_from_object(object_id);
match class_id {
    Ok(class_id) => class_id,
    Err(hr) => hr,
}
Or use the ? operator to return the error from the function enclosing the call.
let class_id = profiler_info.get_class_from_object(object_id)?;
Use string types instead of buffers, capacities, and lengths
Most of the Profiling API methods that deal with strings ask for a preallocated WCHAR (unsigned 16-bit integer) buffer to fill with string data. This is not very user-friendly, and it is better to work with Rust string types if possible. Here is an example of a method that returns a string value as an output argument, with the Rust conversions. Note that the profiling method is called with null arguments to get the string size before allocating a buffer and calling again:
fn get_app_domain_info(&self, app_domain_id: AppDomainID) -> Result<AppDomainInfo, HRESULT> {
    let mut name_buffer_length = MaybeUninit::uninit();
    unsafe {
        self.info().GetAppDomainInfo(
            app_domain_id,
            0,
            name_buffer_length.as_mut_ptr(),
            ptr::null_mut(),
            ptr::null_mut(),
        )
    };

    let name_buffer_length = unsafe { name_buffer_length.assume_init() };
    let mut name_buffer = Vec::<WCHAR>::with_capacity(name_buffer_length as usize);
    unsafe { name_buffer.set_len(name_buffer_length as usize) };
    let mut name_length = MaybeUninit::uninit();
    let mut process_id = MaybeUninit::uninit();
    let hr = unsafe {
        self.info().GetAppDomainInfo(
            app_domain_id,
            name_buffer_length,
            name_length.as_mut_ptr(),
            name_buffer.as_mut_ptr(),
            process_id.as_mut_ptr(),
        )
    };
    match hr {
        S_OK => {
            let name = U16CString::from_vec_with_nul(name_buffer)
                .unwrap()
                .to_string_lossy();
            let process_id = unsafe { process_id.assume_init() };
            Ok(AppDomainInfo { name, process_id })
        }
        _ => Err(hr),
    }
}
Writing code in this style creates a lot of boilerplate, and it is very easy to make a mistake. Calling the Rust method profiler_info.get_app_domain_info(app_domain_id) will return a struct that contains a plain String. No buffers, capacities, or lengths involved!
Attempting IL Rewriting
Note: Details about IL and how methods are represented in memory can be found in Partition II of the ECMA-335 standard here
One of the main uses of the .NET Profiling API is to rewrite IL bytecode on-the-fly just before the CLR JIT-compiles a method body to native code. This allows for changing the behavior of a program without actually modifying the assembly itself. The two methods that enable this are ICorProfilerInfo::GetILFunctionBody and ICorProfilerInfo::SetILFunctionBody (or ICorProfilerFunctionControl::SetILFunctionBody on .NET Framework 4.5+, which handles the IL body allocation details for you).
In order to rewrite IL, you must first parse the IL in a method body. Methods come in 2 variants: fat and tiny formats. Determining whether a method is fat/tiny can be done using the least 2 significant bits of the first byte of the header (0x3 indicates a fat method, and 02 indicates a tiny method). A tiny method is any method that satisfies the following conditions:
- No local variables exists
- No exceptions exists
- No extra data section exists (used for exception handler tables)
- The operand stack does not exceed 8 entries
- The IL body code size (not counting the 1 byte tiny method header) must be less than 64 bytes (the method size in bytes must be able to be encoded in 6 bits, so the max is 2^6 -1)
After parsing the method header, the IL instructions must be parsed. IL instructions consist of a 1 or 2-byte opcode, and optionally operand parameters. An example of an opcode is beq.s (branch if equal, short format). It is one byte long (0x3B) and has a signed integer operand which indicates an offset (or target) to jump to if the top 2 entries on the operation stack evaluate as equal. So in memory, this operation would look like: [1 byte opcode][1 byte operand][This byte will be the next opcode] Details on opcodes and their expected operands can be found in opcode.def. switch is the only opcode that can have an arbitrary number of operands, which somewhat complicates IL parsing. It contains the number of targets, and then one 32-bit target for each case of the switch.
After parsing a fat format method’s IL instructions the extra data sections (containing exception handler tables) must be parsed. These tables identify which regions of the method’s IL are within try/catch/finally blocks. They have a header and any number of exception handler clauses. Section header and clauses have fat/small variants.
If you want to modify or insert instructions into a method body, the following corrections may need to be made:
- Expand from a tiny method header to a fat method header if any of the tiny method header conditions from above are not met.
- Update the code size in the method header.
- If it is a fat method header, update the max stack value.
- Expand short form opcodes to long form opcodes if the target offset can no longer be stored in an i8.
- E.g. if operand > i8::MAX or operand < i8::MIN then expand
- Update branch targets.
- Update Exception Handler Clause offsets and lengths (length only if you added/removed instructions in a try/catch/finally block).
- Expand Exception Handler Section Headers and Clauses from the small form to the fat form if any of the following conditions are true:
- The try length > u8::MAX
- The handler length > u8::MAX
- The try offset > u16::MAX
- The handler offset > u16::MAX
I was able to write code to successfully parse method headers/instructions/sections into Rust data structures and convert them back into bytes (taking care to preserve little-endianness). The only piece that I am missing is parsing/writing signatures. Fat method headers contain a metadata token which corresponds to a binary signature which is stored in the BLOB heap. These signatures have a special compression algorithm that I haven’t had time to implement.
For further details see here.
Conclusion and Roadmap
This exercise allowed me to learn a lot about the .NET runtime and how profilers work. It also let me dig into the details of implementing Rust/C++ interop code. I am an amateur Rust programmer, so it’s possible that I’ve made some mistakes in safety at the FFI boundary. If I choose to continue to work on this project, the following items still need to be worked on:
- Complete the idiomatic Rust API for all of the MetaData interfaces (currently only a few methods for testing purposes have been implemented).
- Write a comprehensive test suite, testing all methods across multiple .NET versions and multiple operating systems.
- Review the unsafe Rust code and make sure it is actually safe. See if there are better ways to implement FFI interop code.
- Organize modules and types better. Metadata and Profiling types are currently intermingled.